Network Anomaly Detection: San Francisco Bike Share (GitHub)
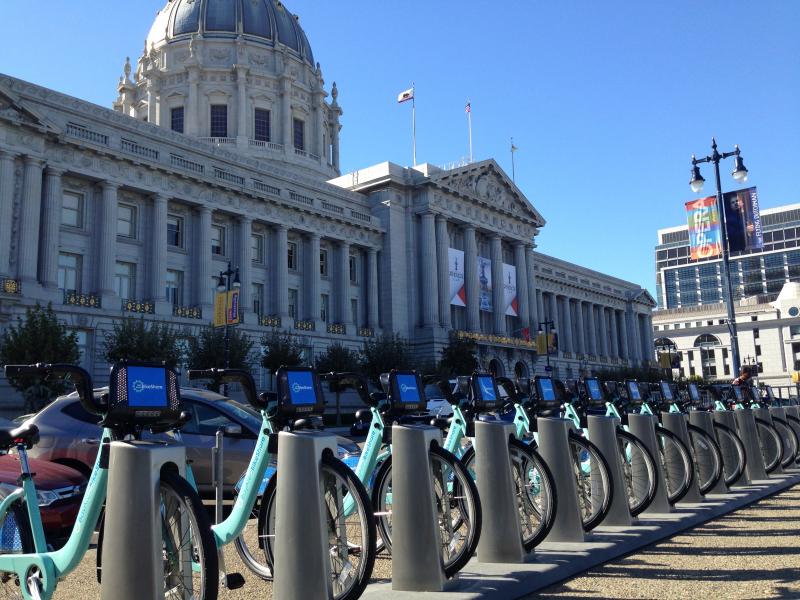
Data on the operation of the San Francisco Bike Share from 09/01/2014 to 08/31/2015 is publicly available.
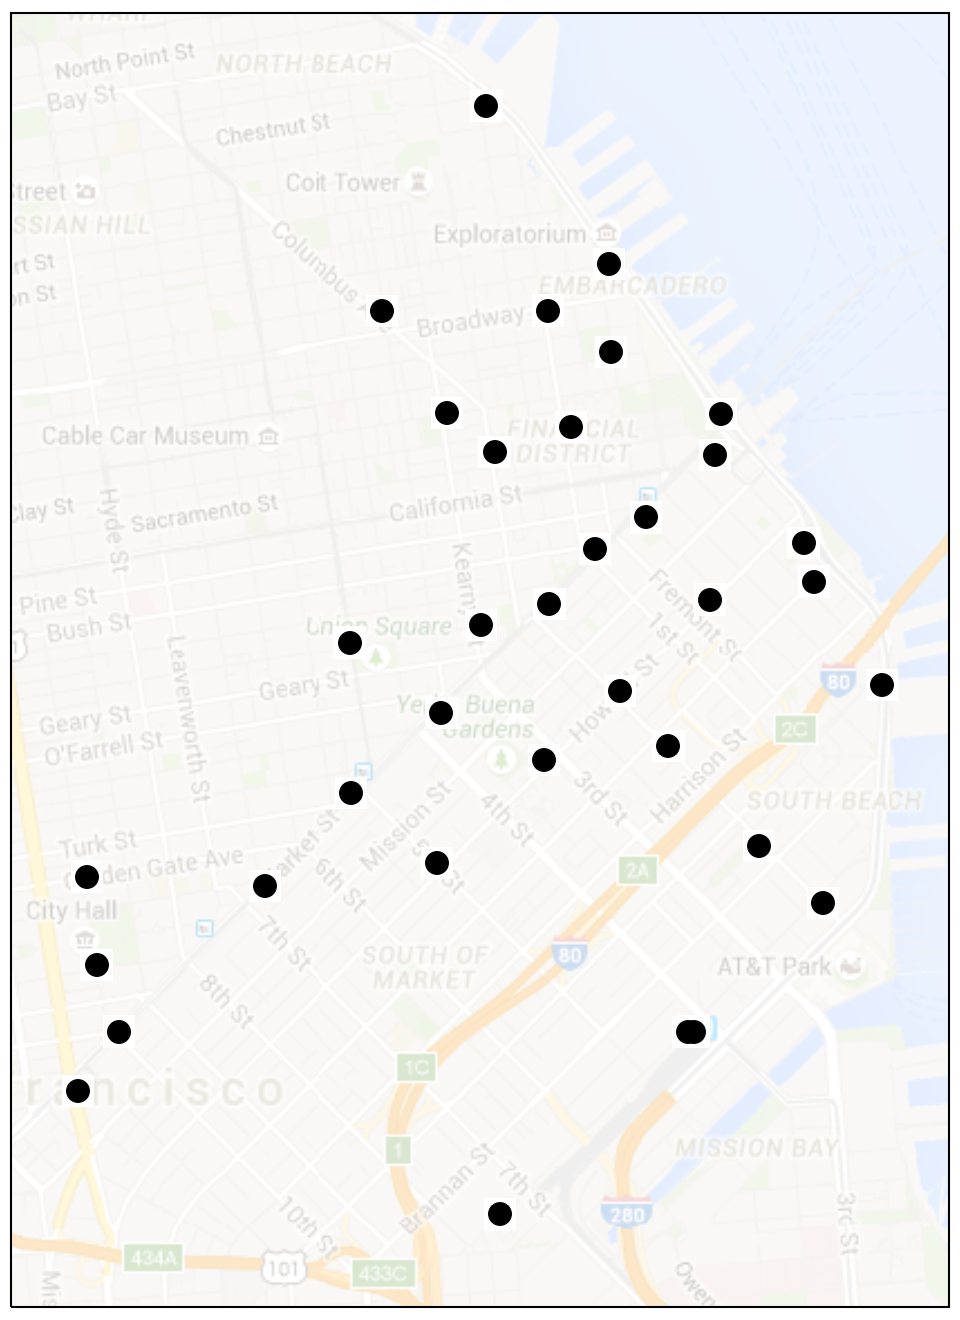
The number of bikes docked at each station is recorded once per minute at each of 35 stations (black disks). I filtered this data to calculate bike availability at all stations between 8:00AM and 9:00AM weekdays.
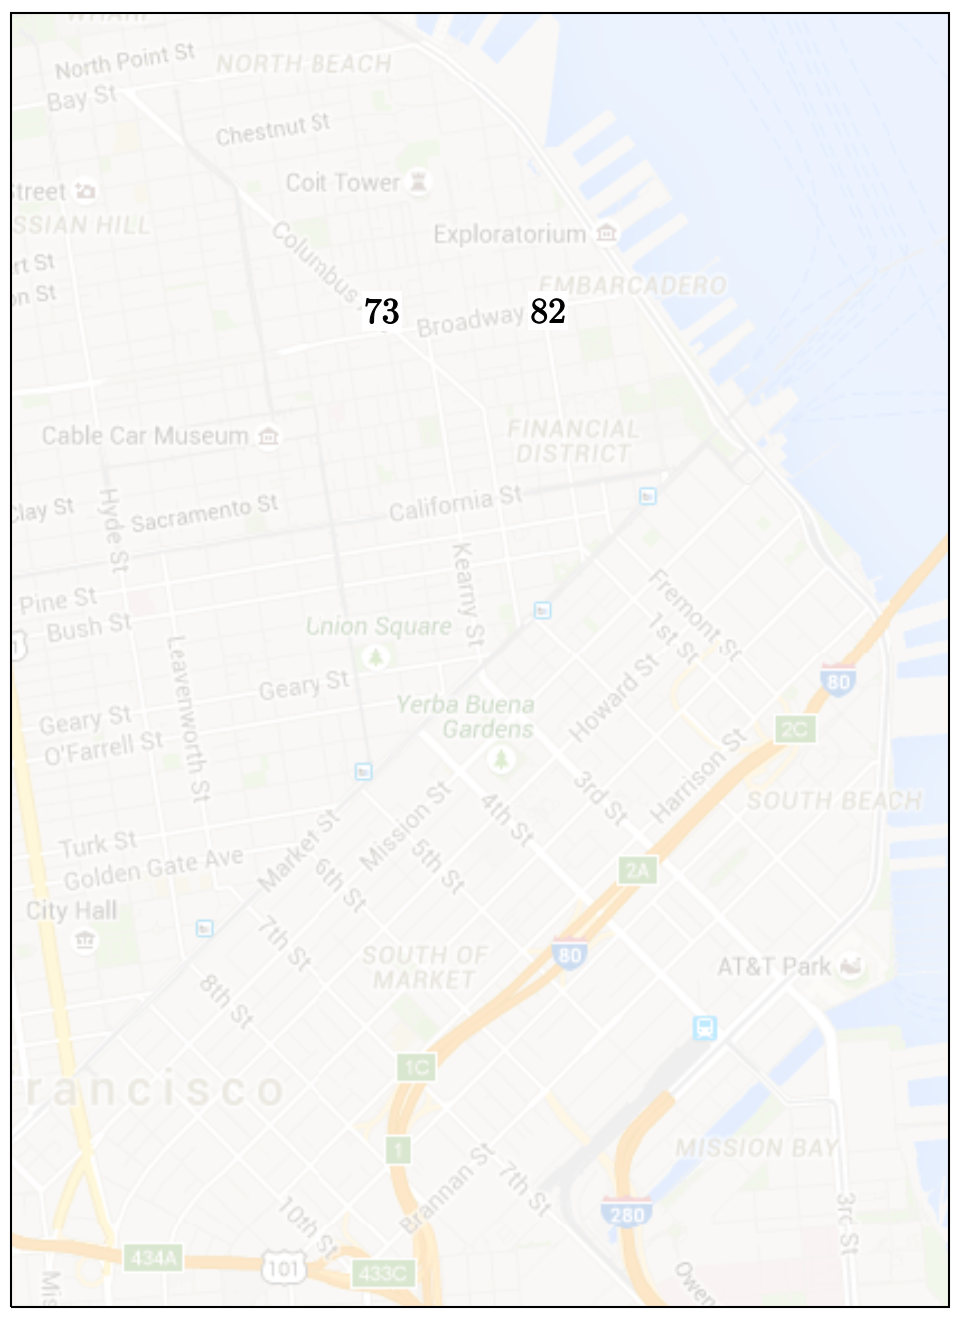
To provide an example of the filtered time series data, I focus on the stations numbered 73 and 82 and . . .
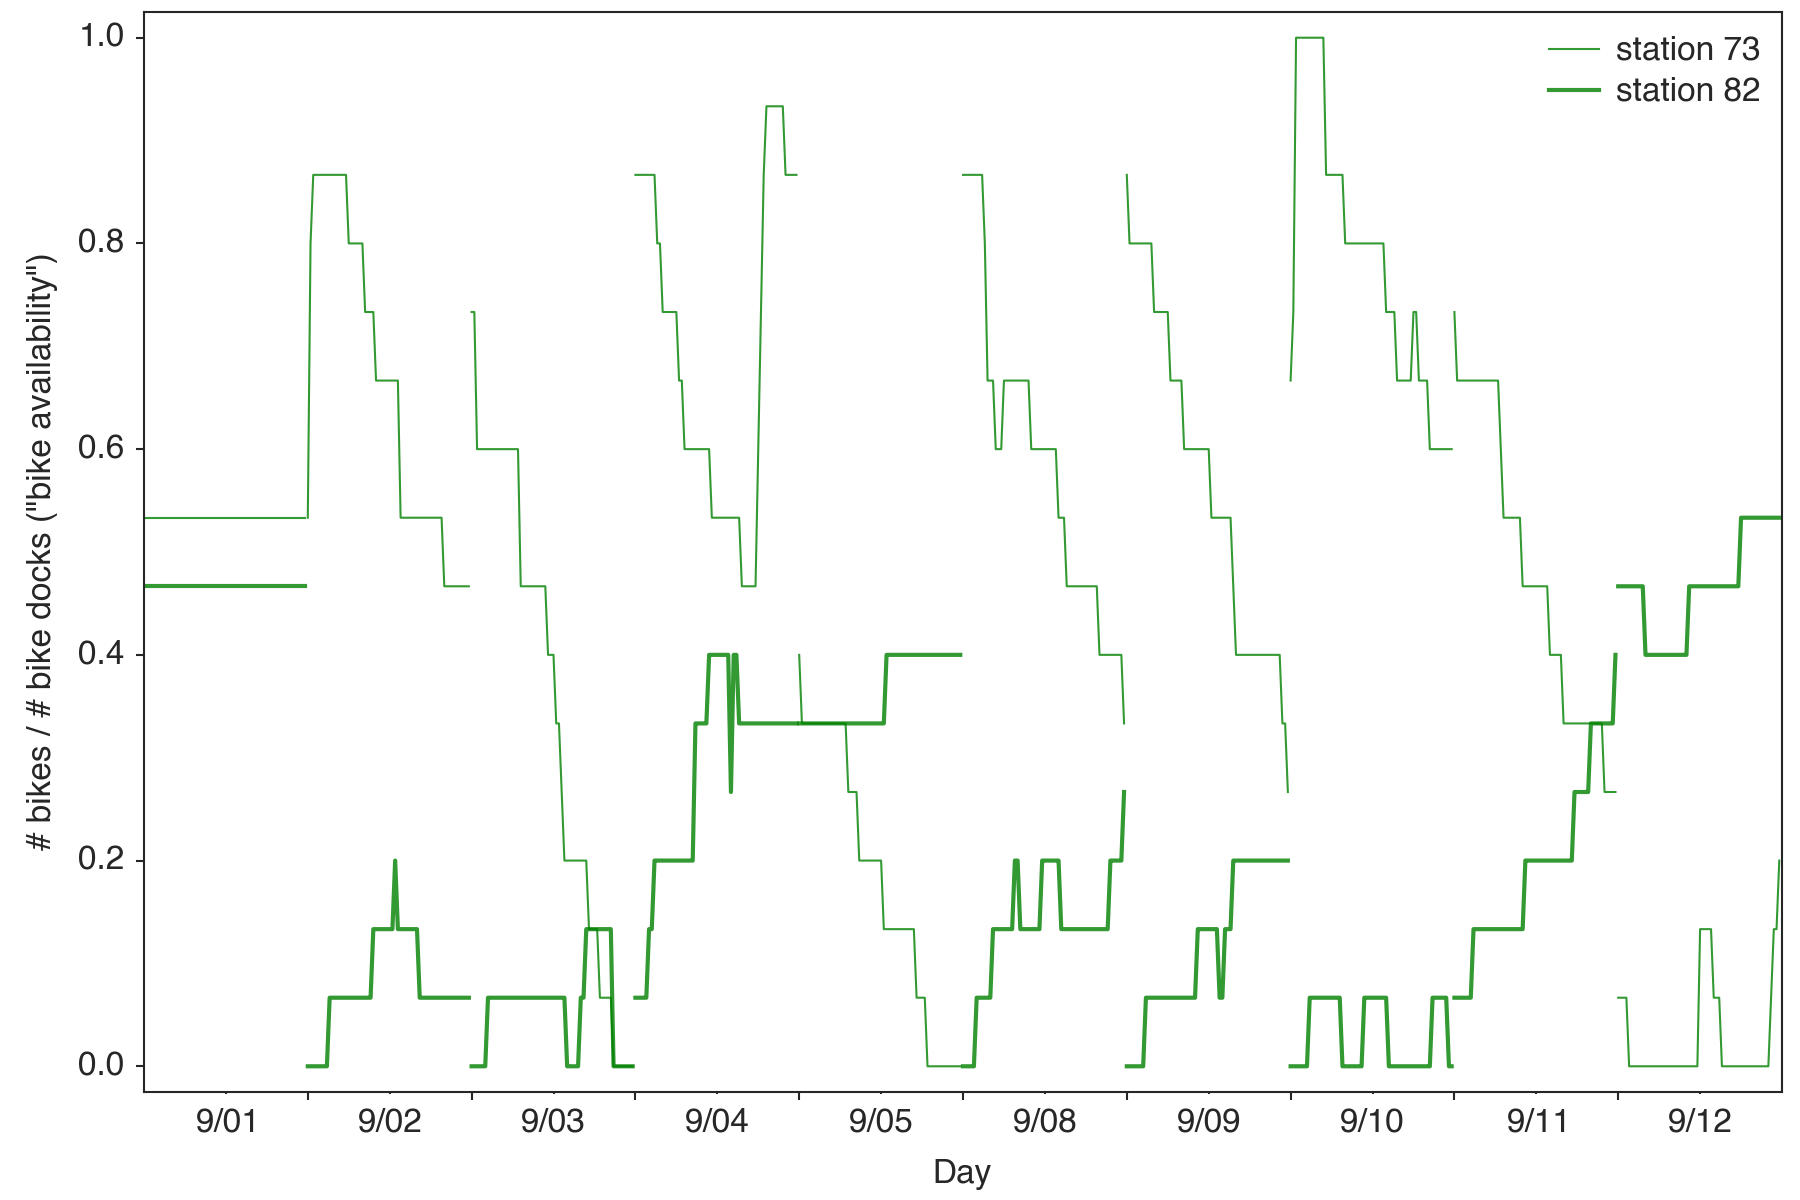
. . . plot morning commute bike availability data for the first two weeks of September 2014.
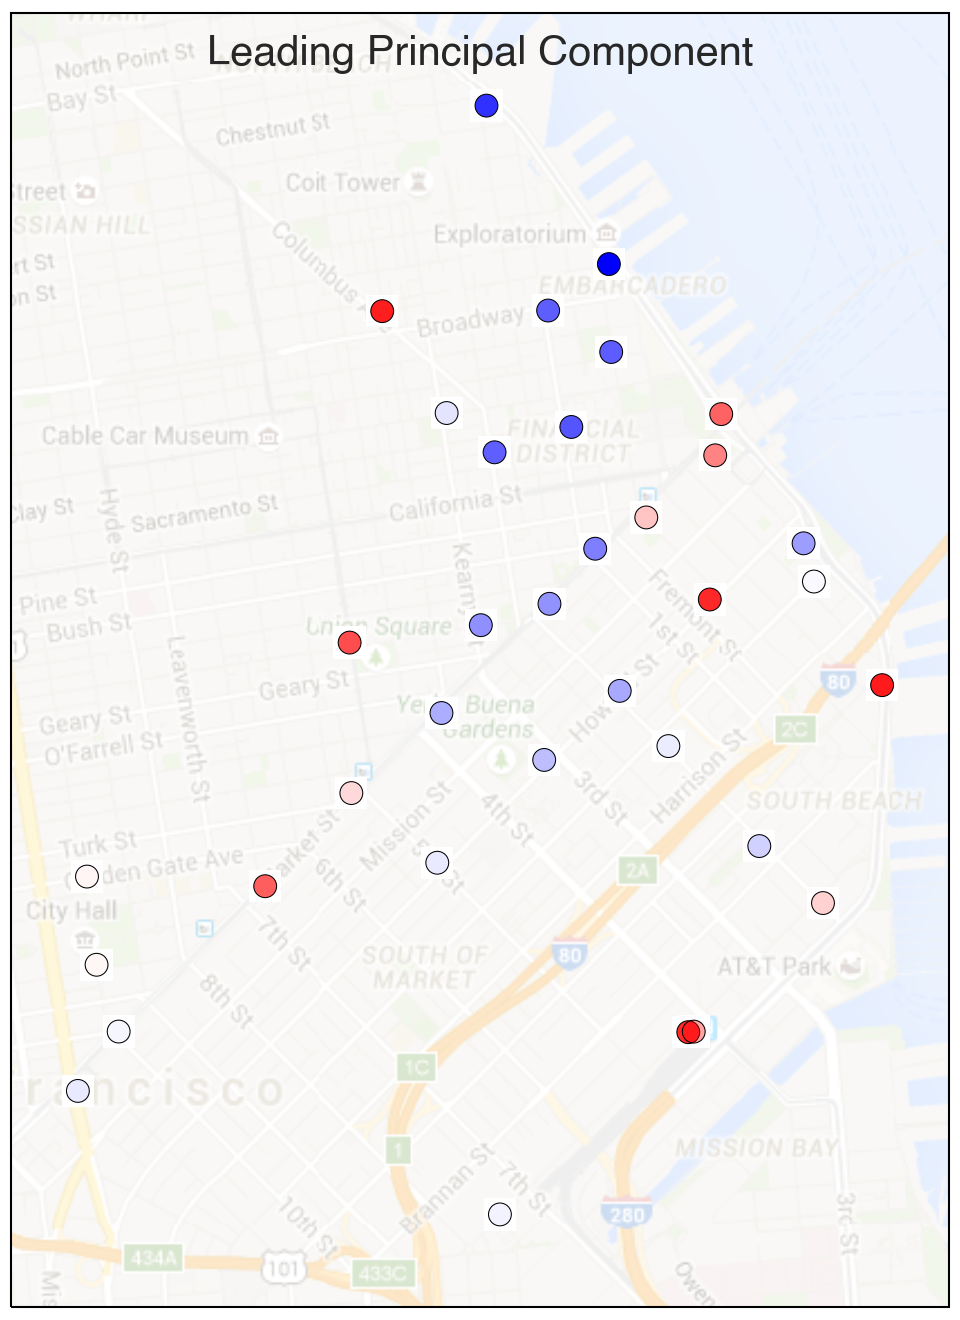
A Principal Component Analysis can be performed on the filtered time series data for all 35 stations. The principal mode of variation over the bike share network is shown here. This mode, describing approximately 15% of overall variation in the data, is a sloshing mode in bike availability as commuters ride from residential areas into downtown business distrincts. Blue and red disks label stations that tend to be out of phase with each other.
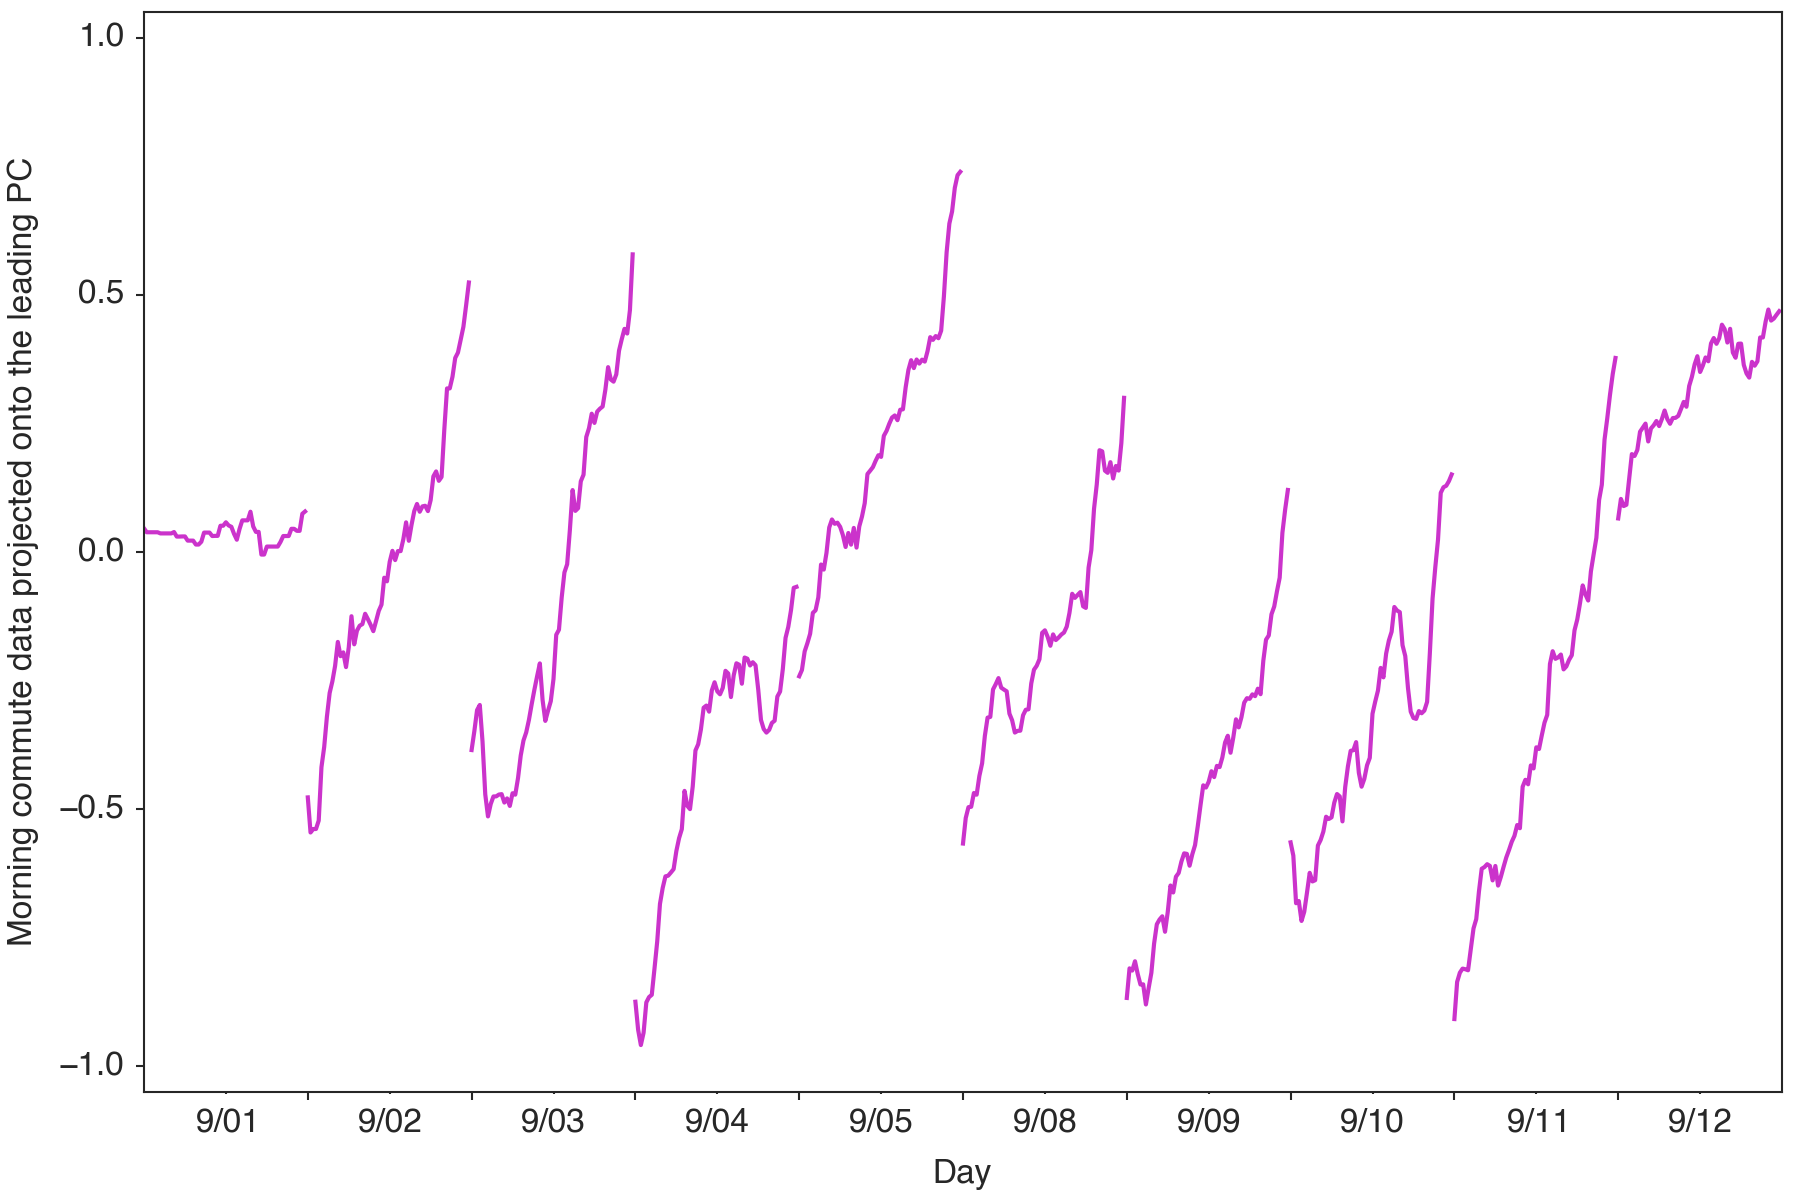
Projecting the principal mode of network variability back onto the data tells us the strength of that mode through time. Can you detect the Labor Day anomaly?